Running host diagnostics
Every host running DNClient has a debug page in the admin panel. From it you can stream the host’s logs live and run diagnostic commands that show what the host knows about its tunnels, its peers’ certificates, and the addresses its lighthouses have reported. This guide covers what each command does, when to reach for it, and how to read the result.
How it works
Section titled “How it works”The debug page doesn’t connect to the host directly. Defined Networking passes each command to DNClient over the connection DNClient already keeps open to Defined Networking, and DNClient sends the result back the same way. You don’t need SSH, an open inbound port, or a VPN to the host’s network, so the debug page works for hosts behind NAT or a firewall.
That also means DNClient has to be running and connected for a command to reach it. The debug page doesn’t offer commands for:
- Mobile devices: Mobile Nebula doesn’t support remote debugging. To read its logs, use the app’s log viewer.
- Hosts that were never enrolled: The page asks you to enroll the host first.
- Blocked hosts: Unblock the host to debug it.
- DNClient older than 0.6.0: The page links to the downloads so you can update it.
If a host is enrolled but DNClient isn’t running or can’t reach Defined Networking, the page shows Unable to connect with a reminder to check that DNClient is running on the host. A command dialog shows Unable to contact dnclient in the same situation.
Open the debug page
Section titled “Open the debug page”- Go to Hosts.
- Open the host’s menu, either the three dots at the end of its row or the More button on the host’s own page, and choose Debug.
The debug page lists the host’s IP address, DNClient version, role, and tags above the console. Click Stream logs to start a log session, or open the menu next to it to run a command.
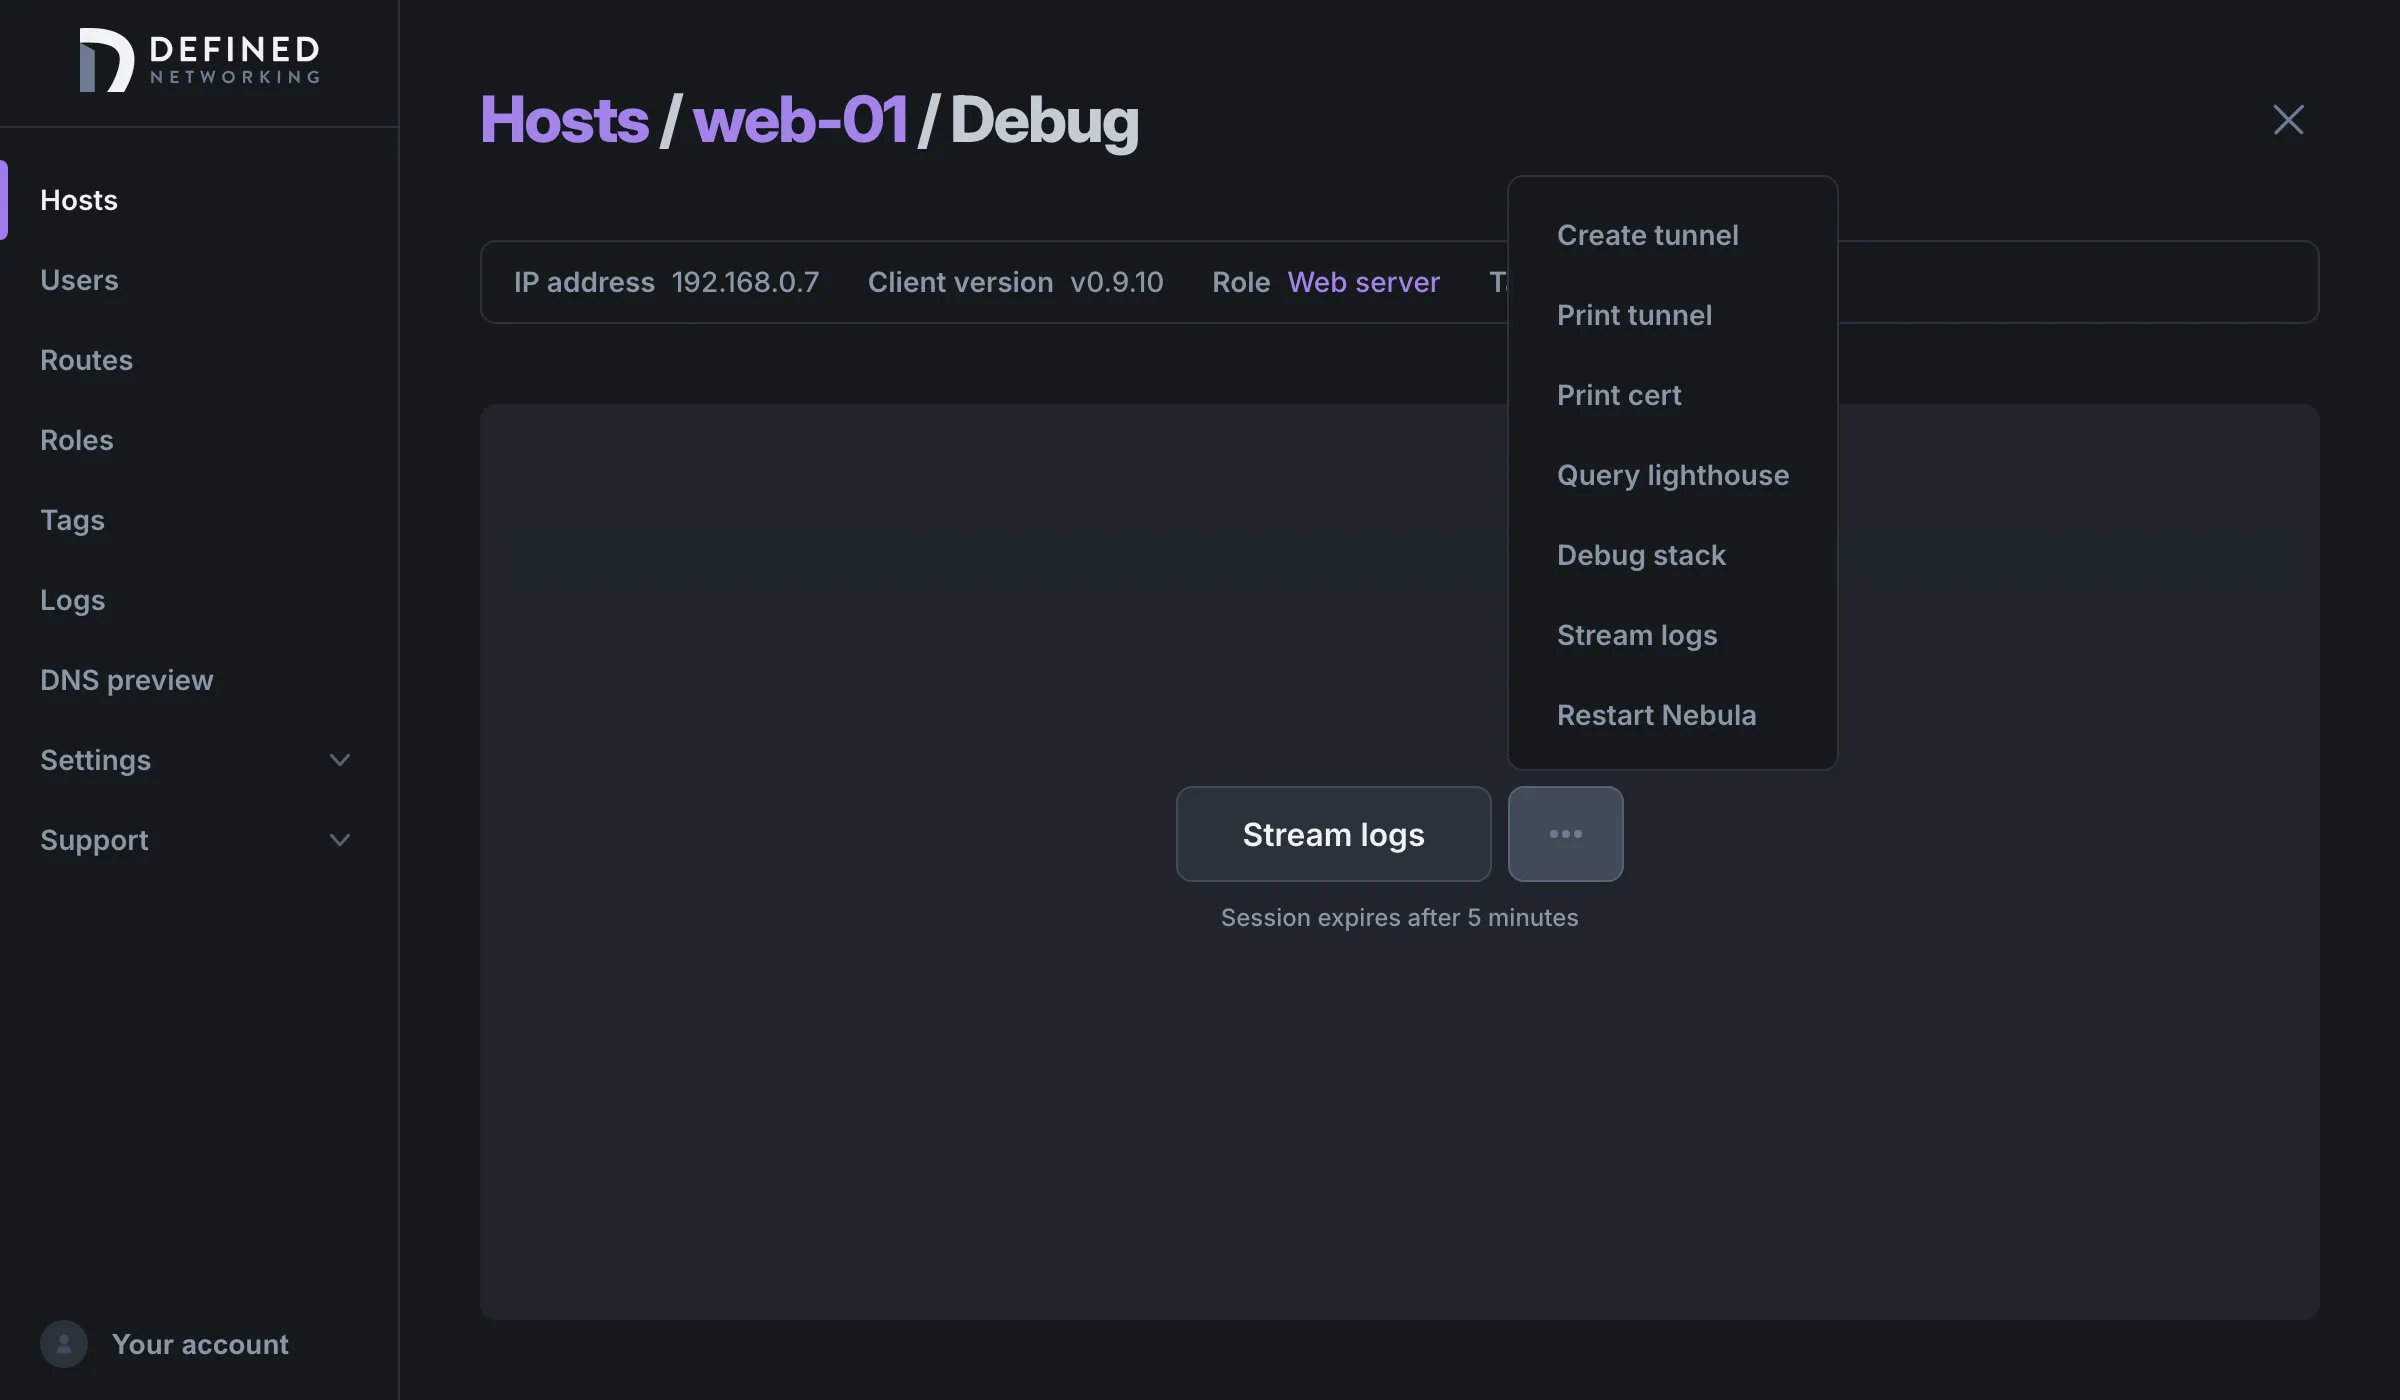
The menu lists only the commands the host’s DNClient supports, so hosts on older versions show fewer. Results appear in the console in the order you run them. Once the console has output, the download button above it saves the logs and command results to a text file you can attach to a support request.
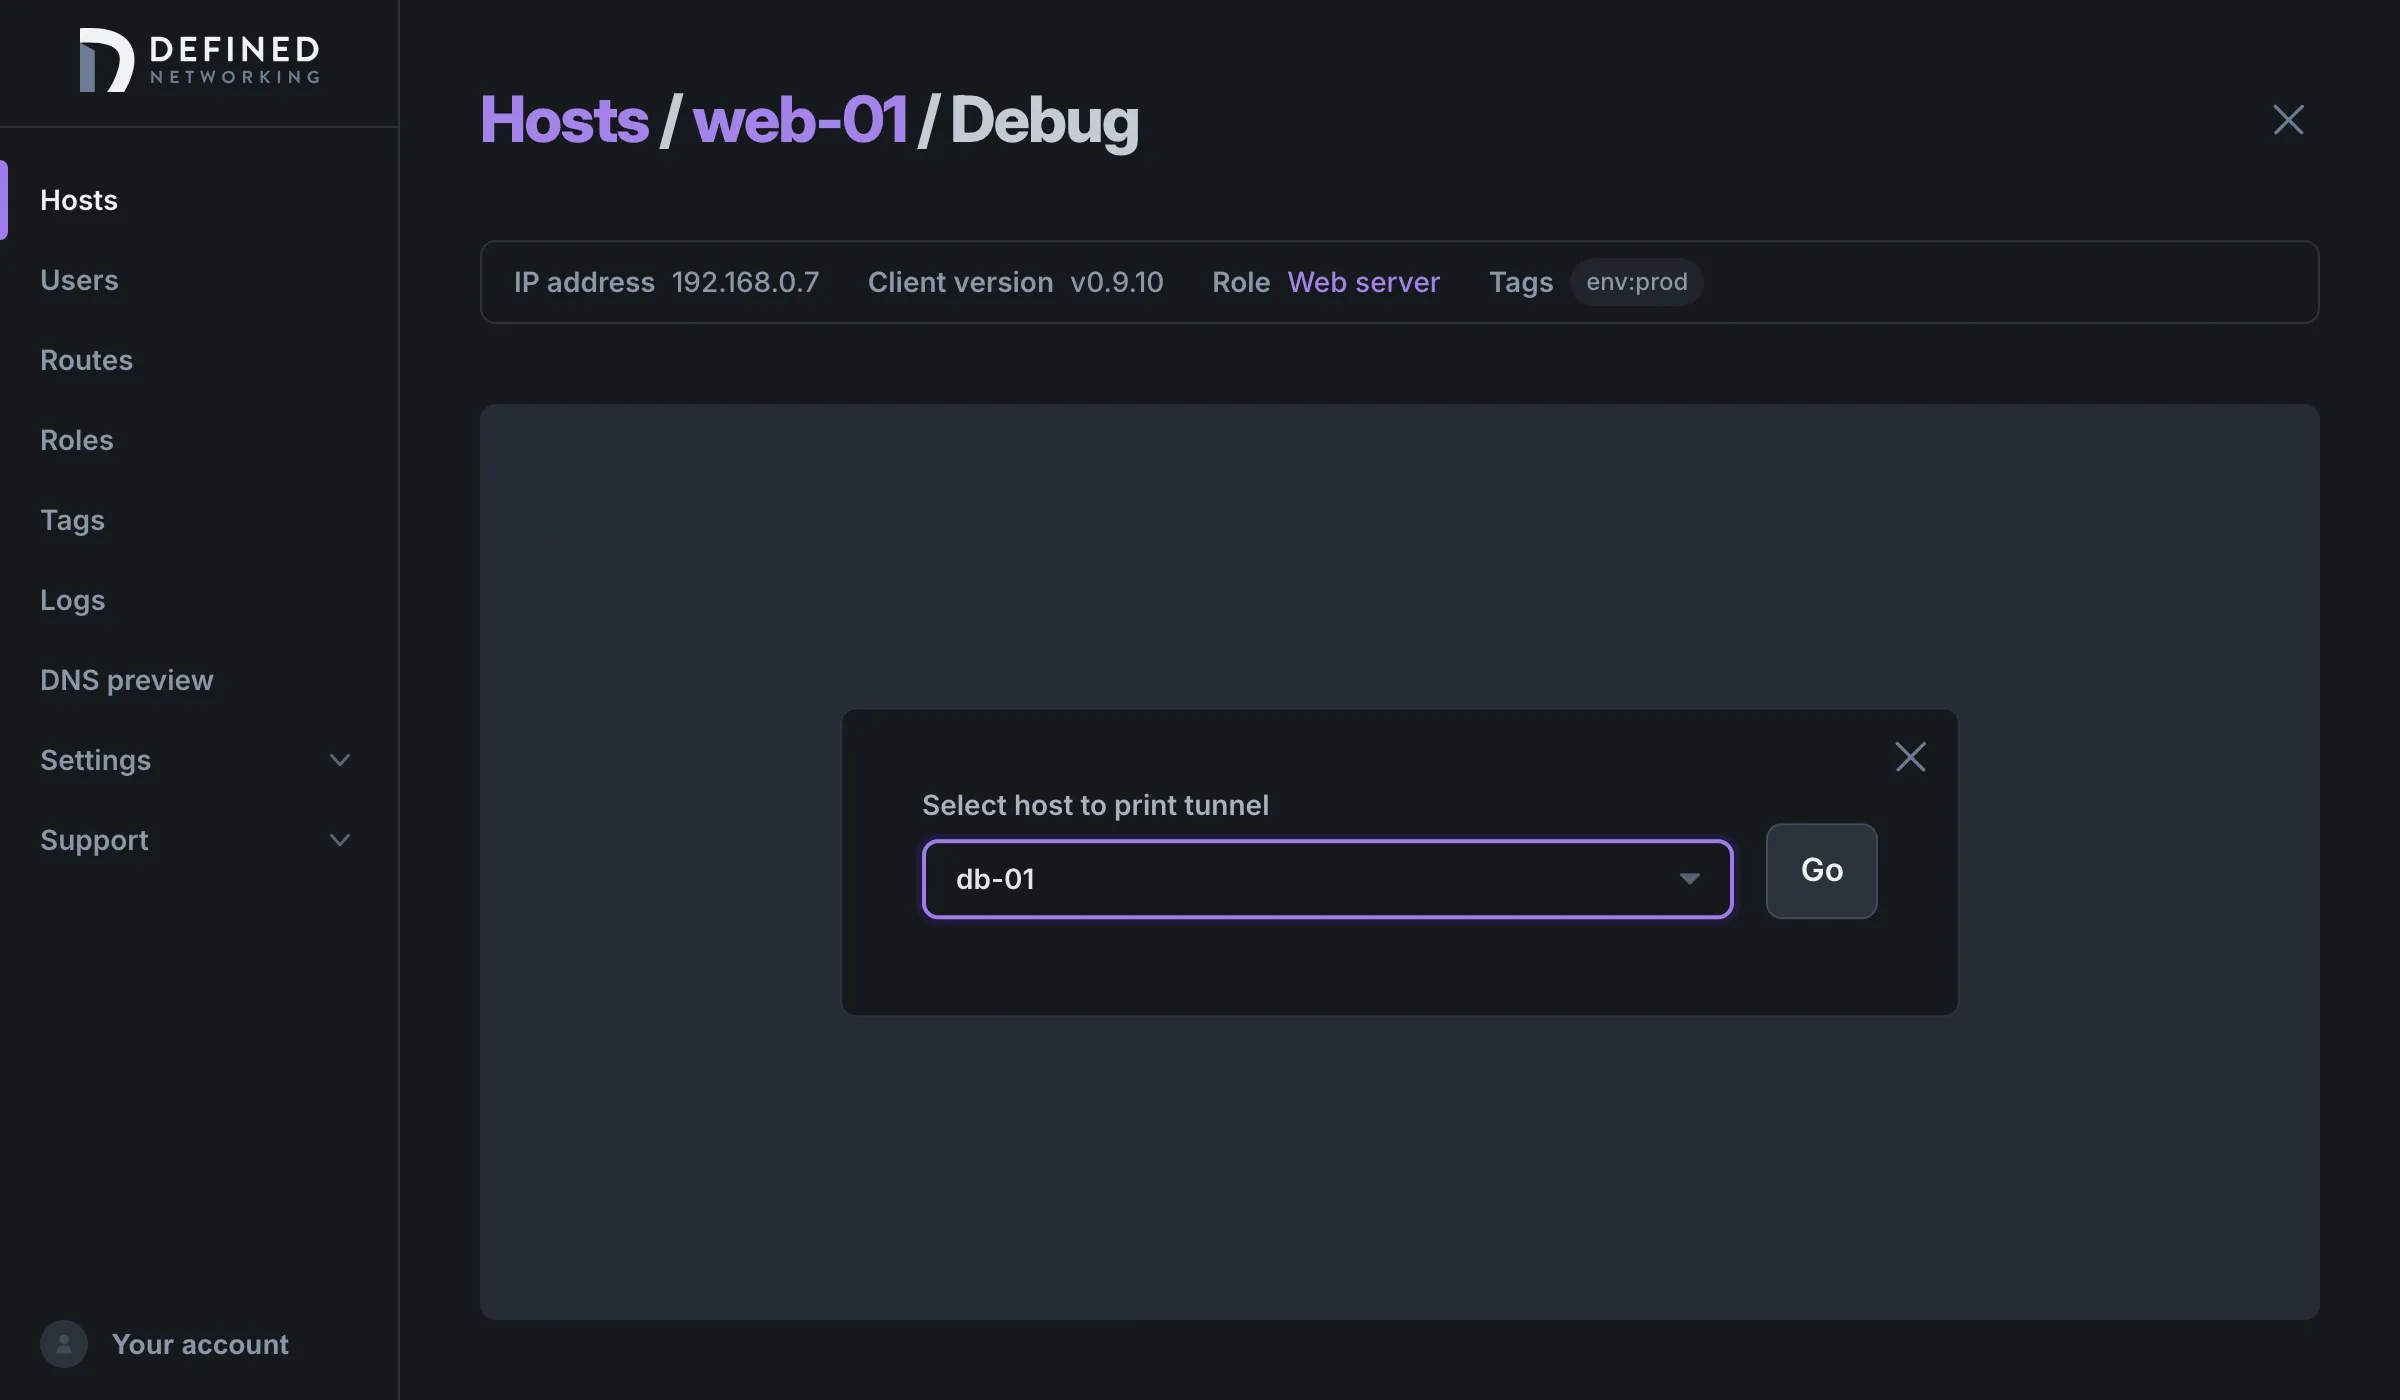
Create tunnel, print tunnel, print cert, and query lighthouse each ask about another host. Choose it from the list, which shows the other hosts in the same network, and click Go. The command runs on the host whose debug page you’re on, and is sent the other host’s overlay IP address.
Stream logs
Section titled “Stream logs”Stream logs shows DNClient’s log messages as they happen, for five minutes. It’s the quickest way to watch a host while you reproduce a problem, like a connection that fails or a host that keeps reconnecting. For logs from before the session, or from a host the debug page can’t reach, read them on the host itself as described in Viewing DNClient logs.
While the session runs, DNClient raises its log level to debug, the most detailed level, and goes back to its configured level when the session ends. You don’t need to change the host’s logging configuration to get detailed logs.
- Healthy: the console reports when the debug session started, and the first line from DNClient is
Log streaming session started. More lines follow as the host does work, such as handshakes with other hosts. A quiet host may log little until something happens. When the five minutes are up, the console shows when the session ended and offers Restart. - Unable to connect: DNClient didn’t answer. Check that it’s running on the host and that the host is online.
- Lost connection: the stream was interrupted partway through. Click Retry to start a new session.
- There was a problem streaming log messages: the session failed for another reason. Contact support from the link on the page.
Create tunnel
Section titled “Create tunnel”Create tunnel tells the host to start a handshake with the host you choose. Use it to test connectivity between two hosts, or to bring a tunnel up ahead of traffic so you can inspect it.
The command returns as soon as the handshake starts and doesn’t wait for the result. An empty result only means DNClient received the command. To see whether the tunnel came up, wait a few seconds and run Print tunnel for the same host, or stream logs while you run it to watch the handshake.
If the tunnel doesn’t come up, the two hosts couldn’t complete a handshake. The usual causes are that the other host is offline, that neither host can reach the other’s addresses over UDP, or that this host doesn’t have an address for the other host yet. Query lighthouse shows which addresses this host has. If the tunnel is up but traffic between the hosts still fails, check the firewall rules on their roles. Nebula’s firewall filters the traffic inside a tunnel, not the handshake that sets it up.
Print tunnel
Section titled “Print tunnel”Print tunnel shows the tunnel this host has to the host you choose. The result, labeled host, includes:
currentRemote, the address and port this host is sending the other host’s traffic to right now.remoteAddrs, every address this host knows for the other host.currentRelaysToMe, the overlay IP of a relay when traffic to the other host goes through one. It’s empty for a direct connection.cert, the certificate the other host presented, described under print cert below.
A healthy result has a currentRemote you’d expect for the other host. Nebula only uses a relay when the hosts can’t reach each other directly, so a relay listed for two hosts you expect to connect directly means neither could reach the other’s addresses. The NAT traversal entry explains how hosts find a direct path.
A result of host=null means there’s no tunnel to that host right now. Nebula only builds tunnels when there’s traffic, so this is normal for hosts that haven’t talked recently. Run Create tunnel first if you want one.
Print cert
Section titled “Print cert”Print cert shows the certificate the host you choose presented when its tunnel with this host was set up. The result, labeled cert, includes the certificate’s name, overlay network, groups, and validity dates, plus its fingerprint and the fingerprint of the issuing certificate authority.
Use it to confirm which identity a peer is using. In a healthy result the name matches the host, networks contains its IP address, notAfter is in the future, and groups includes role: followed by the name of the host’s role. Firewall rules match on these role groups, so a host that’s in the wrong role, or in none, is easy to spot here. The PKI entry explains how Managed Nebula issues and rotates these certificates.
Like print tunnel, a result of cert=null means there’s no tunnel to that host right now, so there’s no certificate to show. Run Create tunnel first.
Query lighthouse
Section titled “Query lighthouse”Query lighthouse asks the network’s lighthouses where the host you choose can be reached, and shows the addresses this host has so far. The first run starts the query and returns what this host already knew, so run it a second time for the up-to-date answer.
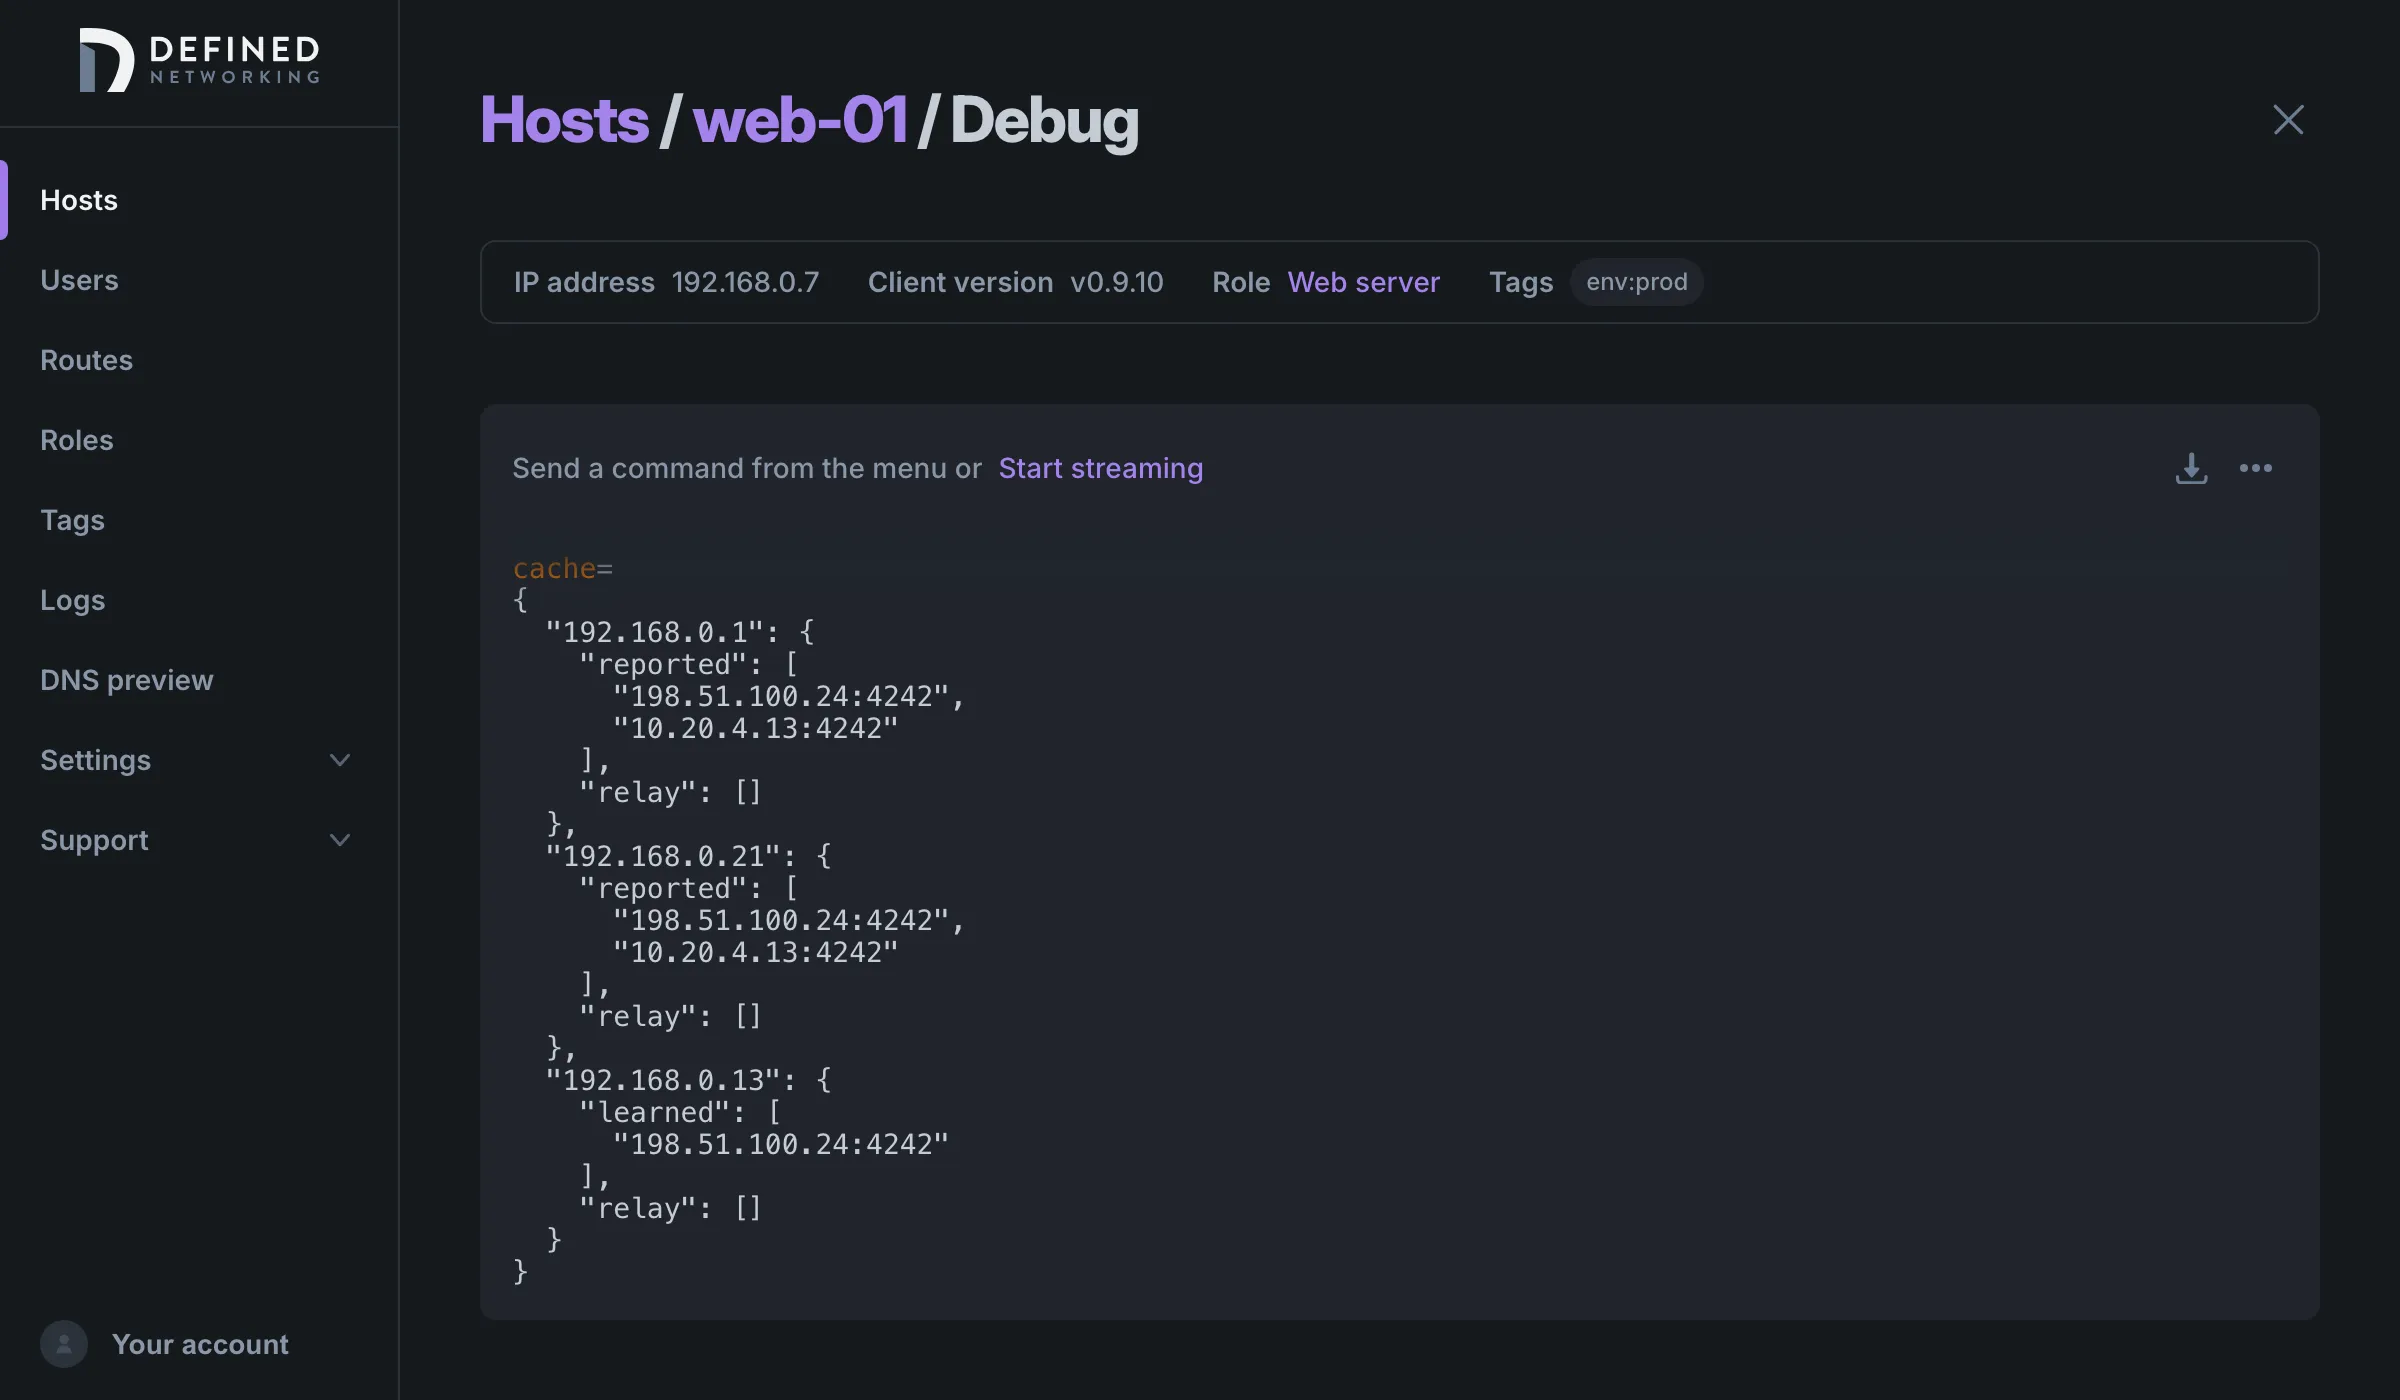
The result, labeled cache, is grouped by who supplied the addresses:
- Under each lighthouse’s overlay IP,
reportedlists the addresses that lighthouse has for the other host, usually the public address it sees the host connecting from and the local addresses the host reported. - Under the other host’s own overlay IP,
learnedlists the address this host has received packets from directly, if any. relaylists relays the other host can be reached through.
In a healthy result, every lighthouse reports the other host’s current addresses. If cache=null even after a second run, or a lighthouse reports no addresses, the other host isn’t reaching the lighthouses. Check that it’s online, and use its own debug page to stream its logs.
Debug stack
Section titled “Debug stack”Debug stack returns a stack trace of every goroutine in the DNClient process, labeled stackTrace. It shows what each part of DNClient is doing at that moment, which is mostly useful to Defined Networking support when DNClient seems stuck or busy. Run it while the problem is happening, then download the console output and include it in your support request.
A healthy result is a long block of text that starts with goroutine. Debug stack requires DNClient 0.6.2 or later.
Restart Nebula
Section titled “Restart Nebula”DNClient 0.9.1 and later also offer Restart Nebula. Unlike the other commands it changes something on the host, so it asks you to confirm first. Restarting tears down all of the host’s tunnels and rebinds its UDP port. Active connections drop and re-establish once Nebula is back up.
Run diagnostics with the API
Section titled “Run diagnostics with the API”The same commands are available through the API’s Debug host operation, with an API key that has the hosts:debug scope. Send the command’s name and, for commands that take one, the other host’s overlay IP address as target.
| Admin panel | API command |
|---|---|
| Stream logs | StreamLogs |
| Create tunnel | CreateTunnel |
| Print tunnel | PrintTunnel |
| Print cert | PrintCert |
| Query lighthouse | QueryLighthouse |
| Debug stack | DebugStack |
| Restart Nebula | Restart |
Through the API, StreamLogs takes a duration of up to 10 minutes and a log level, and returns its log lines as newline-delimited JSON. The other commands return a single JSON response.